What Are The Numbers?
Some amazing work has been done by organisations and scientists across the world. We know what impacts our planet and we know what changes could reduce our impact to an acceptable level. However, knowing does not equal changing.
Real change is realised by the numbers. The good news: most people are willing to change. The bad news: they don’t. There are two principal reasons:
- What are these numbers?
Water usage is the easiest: L/kg. But Greenhouse gas is expressed in kg CO2-eq/kg, Land use in m2⋅y/kg, and from here it gets even more complex. These units make sense, they quantify impact in a relevant way – but are not usable in everyday life.
2. Life gets in the way
Everybody is busy enough. Even if they would understand which choices to make, they need to change their habits – deeply rooted habits. And that costs effort and time. Something most of us do not have.
Bridge The Gap
We have already defined how to take away the need for extra time and effort. With a systemic approach it is very possible to enable consumers to eat more sustainably, while making their lives easier and healthier (and cheaper).
But that system requires simple classifications and practical references. A single number quantifying impact so it is able to compare options. And a reference to evaluate whether something is good or not. How does food A compare to B? And how do they both compare to what is acceptable? A bridge between scientific data and everyday life.
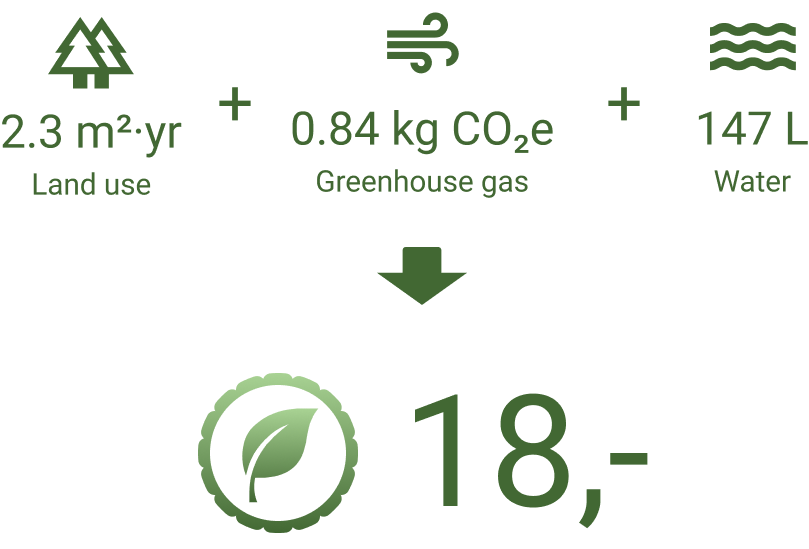
Leaf Cost provides that bridge. It is a simple universally comparable number, summarising all climate impact components. Expressed as “Nature’s cost”: How many leaves did you eat today? How? Keep reading.
Leaf Cost
Working with impact parameters is a multi-dimensional feat. How do you summarise kg CO2-eq/kg greenhouse gas with m2⋅y/kg in land use? Even if they are converted to the same units, what is more important? And once you get there, what is acceptable? 3 dimensions – 3 steps:
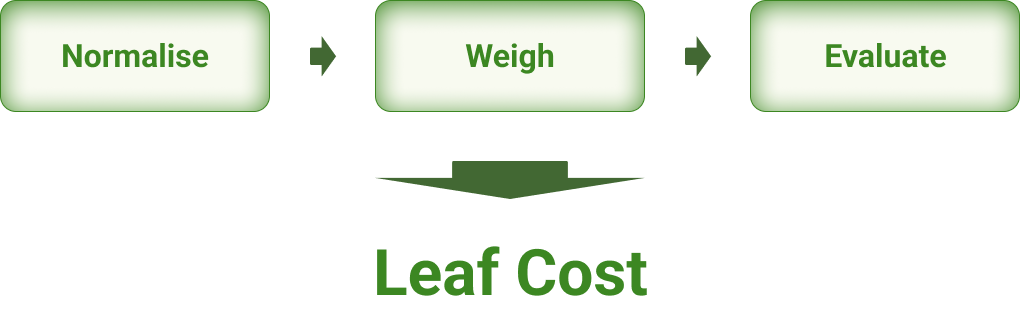
Normalise – Compare With What is Typical
All climate impact components have different units – different rulers.
The easiest way to normalise, is strip the units away, and they all compare to the same ruler. Simply divide the impact of a specific food by the impact of typical food. No units, everything normalised.
The result is simply: This food produces twice the greenhouse gas, and half the water of average food. Everything is comparable.
Weigh – Overshoot Determines Urgency
Now everything is comparable, but we are not ready to summarise into a single number. We need to address the differences in urgency. Not every impact is equally serious.
This is where the Planetary Boundaries framework – applied to the food system by the EAT-Lancet commission – provides the relevant guidance. The level of overshoot determines the weighing factor for each impact component. Simple and effective – what is pushed far past the safe boundary weighs heavily; what is within our boundaries weighs less.
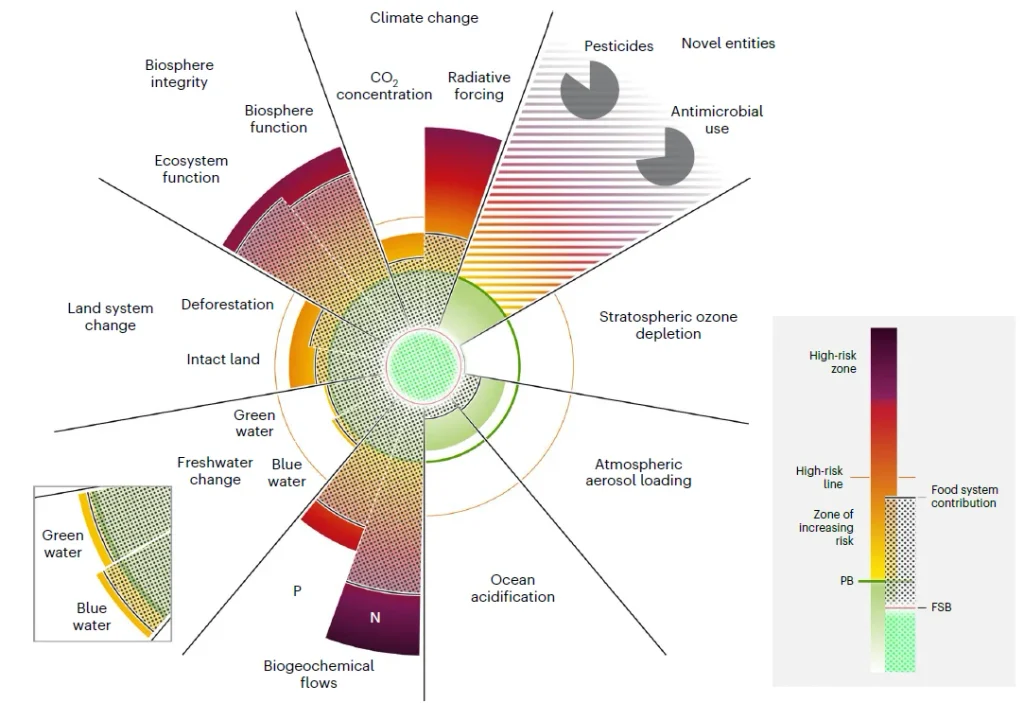
And now we are able to summarise all climate impact components into a single relevant impact number: The Leaf Cost.
Evaluate – Compare With The Reference
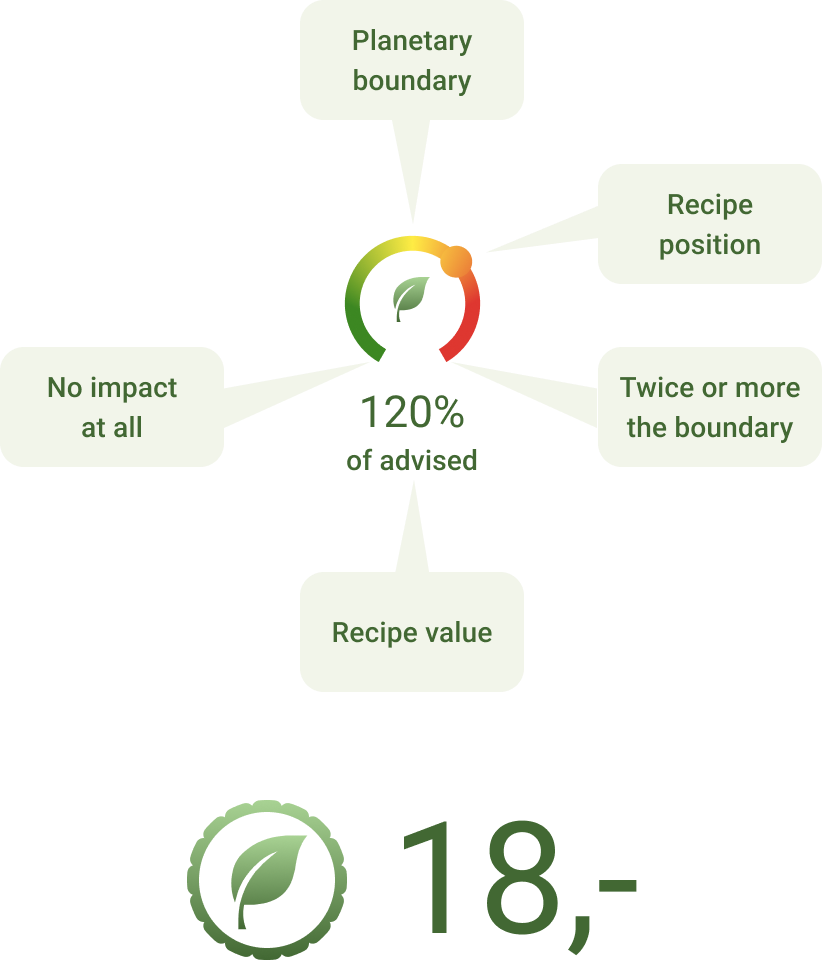
Once the climate impact is expressed in Leaf Cost, we know how much the impact is, but not whether that is acceptable or not.
But that comparison becomes a piece of cake. Calculate the Leaf Cost of the Planetary Health Diet of EAT-Lancet and there is the reference. Clean and simple. Want to use another diet as a reference? Same mechanism. Personalisation at your fingertips.
Impact evaluation realised and ready to be utilised to enable a consumer to eat more sustainably.
Leaf Cost Status
At this moment, the Leftover Lucy Leaf Cost calculator covers greenhouse gas, land- and water usage, but the system is universal. Other impact components can follow the exact same rules and will be added one at a time. The mechanism is set.
Localisation & Production Method
So far we have treated the climate impact calculation mechanism. That is universally applicable. Impact, however, is not homogeneous.
Lettuce from the Sahara has a different impact than lettuce from a field in the Netherlands. E.g. water scarcity matters. A tomato consumed in Italy from Italy has a different impact than a tomato from Spain. Distance matters. A paprika from a field has a different impact than one from a heated greenhouse. Methodology matters. And so on.
This differentiation is not found in the mechanism, but in the data used. Both on the supply-, and demand side.
Supply Side
Great data sets are available with different scopes. And that is a feast!
Poore and Nemecek have prepared an excellent set with global averages. That is a good basis to set the global defaults. RIVM (Dutch National Institute for Public Health and the Environment) has an extensive data set with the scope of foods sold in the Netherlands (sold, not necessarily produced). Useless for consumers in Indonesia, but way more relevant data for people eating in the Netherlands. That is a part of localisation addressed.
Most data sets provide not only specific values, but ranges as well. Those ranges account for differences in production methods, distance travelled and other variations. All within the scope defined. You do not know what the consumer will choose, but at least, it is possible to quantify and visualise the impact of the choices the consumer can make.
One more example to make ingredient impact more specific, is seasonality. Seasonality of produce (in combination with locality) is known. Utilise time as a factor in the Leaf Cost determination, and seasonality is incorporated.
It is the data that determines how specific we can get. This will evolve over time and the mechanism has to be prepared.
So far, we have been evaluating the ingredients, but there are other relevant factors influencing the total impact of our food. For instance our cooking methods and waste. Both add to the equation. In our model to help consumers eat more sustainably, they have their place, and they are also easy to add to the Leaf Cost model. Both can be expressed in Leaf Cost and added to the bill. Cooking cost for recipes, and waste (cutting loss and past shelf life), when they occur. It all fits.
Demand Side
We also need the consumer to share their information. Without their location, no localisation mechanism will work. When buying foods, they still have the choice to buy industrial produce at the megastores or exact portions from the local organic and regenerative farm store. We offer the options – they make the choices that shape their real Leaf Cost.
My Dream
There is a way to make it even more specific. Now we are talking about my BHAG (Big Hairy Audacious Goal – my “I have realised my dream” goal). The Leaf Cost mechanism is truly universally applicable – and can therefore be applied throughout any supply chain. Each step adds its own verified Leaf Cost. Impact can be traced from A to Z and food can be offered against certified Leaf Cost. Climate transparency in its ultimate form.
Just imagine the implications of that! I mean that, please imagine! Not only about how it impacts consumer guidance, but restaurant classification, policy making, and legislation. Every discussion will become real.
Let’s Build It!
There is a lot to do. But the beauty is: We just have to do it! The calculator is operational. These recipes have passed it. Now let’s make it accessible for public use and get it refined. As long as the (scientific) world keeps coming with these beautiful data sets, the Leaf Cost mechanism is capable of building the bridge to everyday use.
Subscribe below to follow along:


Curious about our progress?
Subscribe to our newsletter and stay in the know

Leave a Reply